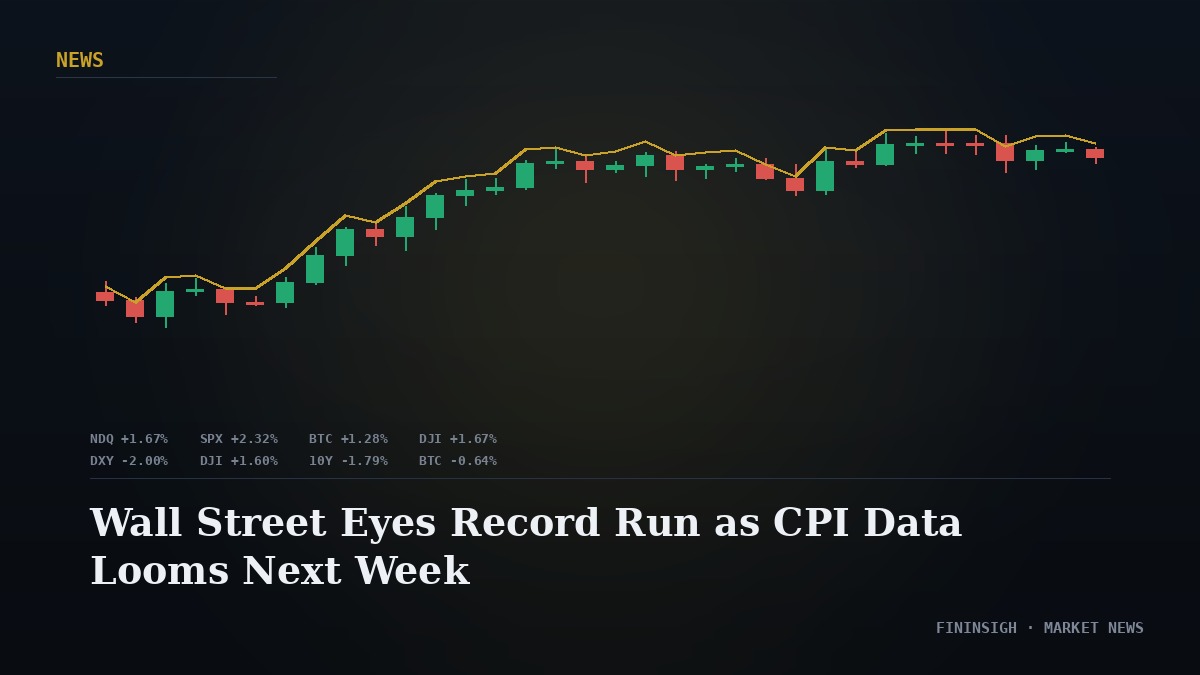

The Cboe Volatility Index, widely known as the VIX, was trading around 15.4 this week — up modestly on the day but still well below the roughly 20 level often cited as its long-run historical average, and far below levels seen during genuine market stress. The reading follows Friday's much weaker-than-expected July jobs report, which reduced expectations of a near-term Federal Reserve rate hike and helped drive a broad rally across stocks, alongside a pullback in Treasury yields.
Where the Numbers Sit
The 10-year Treasury yield fell to around 4.65% following the jobs data, a modest but notable move for a single trading session. Fed funds futures now price the odds of a rate hike at next month's FOMC meeting at roughly 44%, down sharply from about 58% before the jobs report was released. Taken together, these three data points — a quiet VIX, easing yields, and falling hike odds — are telling a broadly consistent story about how markets are currently reading the economic picture.
What the VIX Actually Measures
It's worth being precise about what the VIX is and isn't. It's calculated from the prices of S&P 500 index options and represents the market's expectation of volatility over the next 30 days — in effect, it's a real-time gauge of how much uncertainty options traders are pricing into the near-term future, not a measure of past price swings. A low VIX reading means options markets are pricing relatively calm conditions ahead; it doesn't mean volatility is impossible, only that it isn't currently expected. This distinction matters because the VIX can and does move very quickly when new, unexpected information arrives — its record high above 82 came during the extreme uncertainty of March 2020, illustrating how fast a "quiet" reading can reverse.
Why Yields and Fed Odds Moved Together
The connection between falling Fed rate-hike odds and falling Treasury yields isn't a coincidence — it's mechanical. Treasury yields reflect, among other things, the market's expectations for the path of short-term interest rates over the life of the bond. When incoming data (like a weak jobs report) makes a rate hike look less likely, longer-dated Treasury yields tend to ease in response, since the expected path of rates that yields are pricing in has shifted lower. This is part of why a single data release — one jobs report — was able to move three seemingly separate indicators (stocks, yields, and implied volatility) in a coordinated way: they're all responding to the same underlying shift in expectations about Fed policy.
The Trap in Reading Low Volatility as Safety
A quiet VIX reading is often loosely translated in financial media as "markets are calm" or "risk is low," but that framing deserves some skepticism. Low implied volatility reflects what options traders currently expect, based on currently available information — it says relatively little about risks that haven't yet become visible or priced in. Periods of unusually low, sustained volatility have, at various points historically, preceded sharp increases rather than reliably predicting continued calm, partly because low volatility itself can encourage more leveraged position-taking, which can amplify moves once a genuine surprise does arrive. None of this means a low VIX is meaningless — it's a real, useful gauge of current market sentiment — but treating it as a forward-looking safety signal, rather than a snapshot of current expectations, is a common and worth-avoiding misread.
What to Actually Watch
For readers tracking this data going forward, the more useful habit is watching the relationship between these indicators rather than any single one in isolation. A VIX that stays low while yields and Fed-odds pricing swing sharply on new data (as happened this week) reflects a market that's processing new information efficiently, not one that's ignoring risk. A VIX that stays low despite genuinely destabilizing news, on the other hand, would be a more interesting and worth-watching divergence. For background on how data releases like Friday's jobs report move markets more broadly, see our guide on how economic data moves financial markets, and for the Fed-specific angle, see our related coverage of the Fed's credibility discount.